
Q3 2026 Results at a Glance
Betting Signals made 736.0 units of profit and a 10.4% yield from 7,051 football signals between July and September 2026. The win rate was 48.1%, and all three months were profitable.
These results use the odds available before each drop, at flat one-unit stakes. They only apply if you can still get a price close to that one, usually at a slower bookmaker. Prices make a large difference, so please read “How We Calculate These Results” below before relying on the headline figures.
| Metric | Q3 2026 |
|---|---|
| Signals | 7,051 |
| Matches covered | 5,993 |
| Won / lost | 3,343 / 3,604 |
| Void / no result | 57 / 47 |
| Win rate | 48.1% |
| Profit | +736.0 units |
| Yield | 10.4% |
| Average moneyline odds, before drop / at alert | 2.68 / 2.11 |
New to this topic? Start with our guide to what dropping odds are.
Monthly Results: July, August and September 2026
September was the strongest month at 13.1% yield, while July was the weakest at 4.3%.
| Month | Signals | Win rate | Profit (units) | Yield |
|---|---|---|---|---|
| July | 1,857 | 46.6% | +79.9 | 4.3% |
| August | 2,358 | 48.5% | +285.6 | 12.1% |
| September | 2,836 | 48.8% | +370.5 | 13.1% |
| Q3 total | 7,051 | 48.1% | +736.0 | 10.4% |
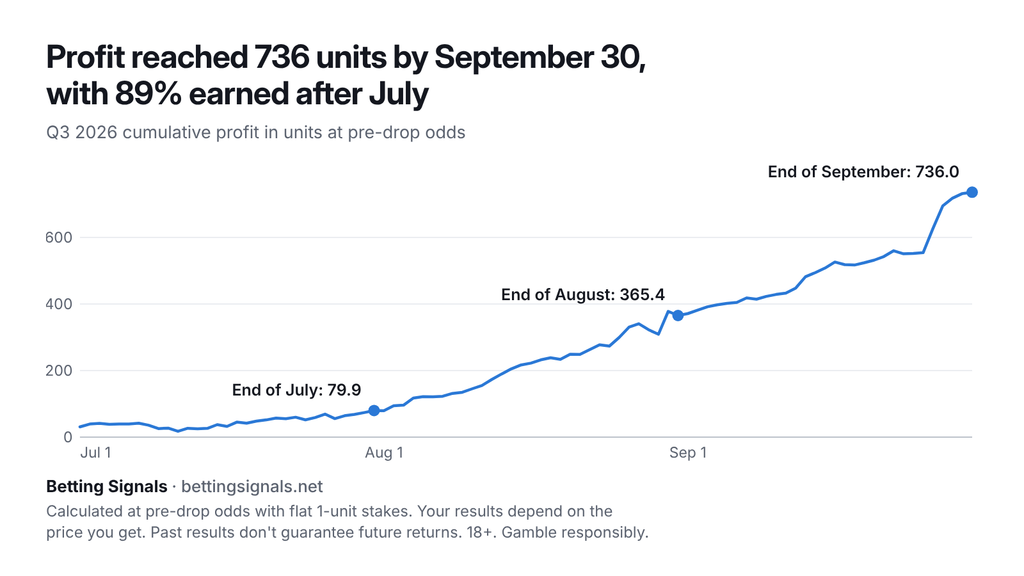
The path wasn’t smooth. Of the 91 days with results, 68 were profitable and 23 were losing. The largest drawdown was about 60 units, on August 28 and 29, and the longest losing run was 12 signals.
Profit was also uneven. September 26 and 27 added 140.4 units, or 19% of the quarter’s total.
Which Betting Signals Performed Best in Q3
Spreads had the highest yield at 13.0%, while moneyline signals made the most profit at 546.6 units. Draw signals were the clear weak spot, losing 61.1 units.
Results by Market
| Market | Signals | Win rate | Profit (units) | Yield |
|---|---|---|---|---|
| Moneyline | 5,446 | 44.6% | +546.6 | 10.0% |
| Spreads | 1,187 | 61.4% | +154.1 | 13.0% |
| Totals | 418 | 58.9% | +35.2 | 8.4% |
Win rates aren’t directly comparable across markets because moneyline odds are higher on average. Spreads and totals use assumed odds of 1.85, as explained below.
Results by Selection
| Selection | Signals | Win rate | Profit (units) | Yield |
|---|---|---|---|---|
| Home | 3,556 | 50.9% | +524.5 | 14.7% |
| Away | 2,886 | 45.0% | +237.4 | 8.2% |
| Draw | 191 | 20.6% | -61.1 | -32.0% |
| Over | 272 | 60.4% | +30.4 | 11.2% |
| Under | 146 | 56.0% | +4.7 | 3.3% |
Moneyline Results by Odds Before the Drop
| Odds | Signals | Win rate | Profit (units) | Yield |
|---|---|---|---|---|
| Under 2.00 | 1,094 | 62.5% | +105.2 | 9.6% |
| 2.00 to 2.49 | 1,465 | 52.7% | +249.8 | 17.0% |
| 2.50 to 2.99 | 1,060 | 40.7% | +119.7 | 11.3% |
| 3.00 to 3.99 | 1,598 | 29.6% | +12.2 | 0.8% |
| 4.00 and over | 229 | 28.6% | +59.8 | 26.1% |
Moneyline Results by Size of Drop
| Drop | Signals | Win rate | Profit (units) | Yield |
|---|---|---|---|---|
| Under 20% | 1,188 | 55.9% | +92.4 | 7.8% |
| 20% to 24.9% | 1,962 | 42.7% | +87.1 | 4.4% |
| 25% to 29.9% | 1,071 | 42.3% | +137.9 | 12.9% |
| 30% to 39.9% | 817 | 38.2% | +97.7 | 12.0% |
| 40% and over | 408 | 38.9% | +131.6 | 32.3% |
The largest drops show the highest yield, but they also leave the biggest gap between the price we record and the price after the move. Treat that 32.3% with caution.
Results by Market Limit
| Logged limit | Signals | Win rate | Profit (units) | Yield |
|---|---|---|---|---|
| Up to 125 | 4,833 | 49.9% | +631.5 | 13.1% |
| 150 to 500 | 2,033 | 45.1% | +126.6 | 6.2% |
| Over 500 | 185 | 34.1% | -22.1 | -12.0% |
Lower-limit markets produced 86% of the profit. These markets may be smaller and may not accept large stakes, so these returns may be harder to scale.
Countries and Half-Time Markets
Signals covered 667 competitions. Among countries with at least 100 signals, Iceland (28.7%), Spain (27.4%) and Japan (20.8%) had the highest yields. Poland (-12.4%), the USA (0.7%) and Brazil (2.8%) had the lowest.
Half-time markets returned 32.4%, but from only 157 signals. One quarter of results on samples this small says little about what to expect next.
How We Calculate These Results
Every figure in this report comes from the Q3 signal log and is settled at the odds or line before the drop. We recalculated 6,935 of the 7,004 recorded results from the match scores, and all of them matched.
- Stakes: Each signal is one unit, so results don’t depend on bankroll size.
- Moneyline odds: Profit uses the price before the drop. For example, a winning signal listed as 3.64 to 2.69 is recorded as +2.64 units.
- Spreads and totals: These settle on the line before the move at assumed odds of 1.85 because the log records lines, not their prices.
- Quarter lines: These count as a full win or loss, not a half result. Half-settlement would add 8.1 units overall.
- Win rate: Won signals divided by won and lost signals. Voids and signals with no result are excluded.
- Yield: Total profit divided by all 7,051 signals, the same calculation as our Q2 figures. Excluding the 104 void or no-result signals, yield would be 10.6%.
- Missing data: 69 recorded results have no score in the log, so we couldn’t recalculate them. They remain in the totals and net -41.1 units. The 47 signals with no result add no profit or loss.
- Statistical range: 931 matches produced more than one signal, so signals aren’t fully independent. Resampling by match gives a 95% range of 7.6% to 13.4% for yield at pre-drop odds.
See our methodology for how signals are found and filtered.
How Much the Price You Get Changes the Result
The same moneyline signals swing from a 10.0% profit before the drop to a 12.7% loss at the alert price. This is the most important thing to understand before you use these figures.
| Moneyline odds used | Signals | Profit (units) | Yield |
|---|---|---|---|
| Before the drop (this report) | 5,446 | +546.6 | +10.0% |
| Closing odds | 4,614 | -284.6 | -6.2% |
| After the drop, at the alert | 5,446 | -692.8 | -12.7% |
The closing row covers signals with a usable price history. Those same 4,614 signals made +487.3 units, a 10.6% yield, at pre-drop odds. Their average odds were 2.66 before the drop, 2.09 at the alert, and 2.29 at the close.
- Break-even: Moneyline signals stop being profitable once your odds average about 9% below the pre-drop price. A 2.50 price would need to be about 2.27 or better.
- A small gap costs a lot: Odds 5% below the pre-drop price cut the moneyline yield to about 4.6%.
- Closing line value: Compared with closing odds, the pre-drop price averaged +17.5%, while the alert price averaged -7.1%. The alert price beat the close only 19% of the time.
- Spreads and totals: Settled on the line after the move at the same assumed 1.85 odds, spreads lose 191.0 units and totals lose 58.4 units.
This log doesn’t record prices at slower bookmakers, so it can’t show how often pre-drop odds were still available when an alert arrived. Compare prices before you bet, and skip a signal if the value has gone. Our guide explains how to use betting signals.
How Q3 Compares With Q1 and Q2
Q3 made 5.5 more units than Q2 from 2,138 fewer signals, lifting yield from 8.0% to 10.4%. Q1 remains the highest-profit quarter of 2026 so far.
| Quarter | Signals | Profit (units) | Yield |
|---|---|---|---|
| Q1 2026 | 9,093 | +836.0 | 9.2% |
| Q2 2026 | 9,189 | +730.5 | 8.0% |
| Q3 2026 | 7,051 | +736.0 | 10.4% |
For the Q3 win rate and results at different prices, see the sections above.
Frequently Asked Questions
What was the Betting Signals win rate in Q3 2026?
The win rate was 48.1%, with 3,343 of 6,947 won or lost signals winning. Win rate alone doesn’t show profitability, because the odds matter too.
How much profit did Betting Signals make in Q3 2026?
The Q3 result was +736.0 units and a 10.4% yield at flat one-unit stakes, calculated at pre-drop odds.
How many signals were included?
The report covers 7,051 football signals across 5,993 matches and 667 competitions. It doesn’t include basketball.
Which odds are used to calculate the results?
Moneyline results use the odds before the drop. Spreads and totals use the line before the move at assumed odds of 1.85.
Can I expect the same results?
Not necessarily. Your results depend on the price you get. Moneyline signals made 10.0% at pre-drop odds but lost 12.7% at the odds shown after the drop, and past performance doesn’t guarantee future results.
Which market performed best?
Spreads had the highest yield at 13.0%, based on assumed odds of 1.85. Moneyline signals made the most profit, at 546.6 units.
Are losing signals included?
Yes. The totals include 3,604 lost signals, and this report also shows the weaker months, selections, and markets.
See Today’s Dropping Odds
Each alert shows the match, market, odds before the drop, current odds and size of the move, so you can compare prices before deciding. View football dropping odds or see what’s included in Betting Signals Premium.